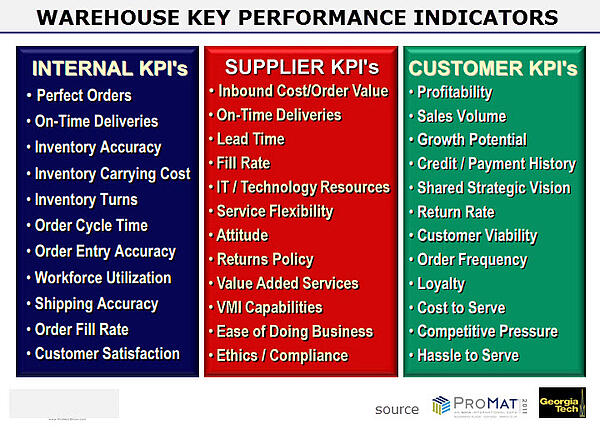
To understand how the warehouse operational performance can be improved, there needs to be an assessment relative to an achievable "standard" or "benchmark." There are two pieces to this: Measurement/metrics and benchmarks.
Measurement/Metrics:
Metrics are a valuable measuring tool but they can be overwhelming if your tracking too many of them. Metrics should not take the human element out of evaluating your personnel. Each business must decide what metrics are valuable and track for production and trend purposes. Metrics need to be evaluated interdependently and find their relationships.
Here is a list of standard key performance indicators related to a warehouse:

Order Fulfillment
On-Time Delivery % - Orders On-Time vs Total Orders Shipped
Order Fill Rate % - Orders Filled Complete vs Total Orders Shipped
Order Accuracy % - Error-Free Orders vs Total Orders Shipped
Line Accuracy % - Error-Free Lines vs Total Lines Shipped
Order Cycle Time Hours - Actual Ship Date Minus vs Customer Order Date
Perfect Order Completion % - Perfect Deliveries vs Total Orders Shipped
Inventory Management
Inventory Accuracy % - Actual Quantity per SKU vs System Reported Quantity
Damaged Inventory % - Total Damage $$$ vs Inventory Value (Cost)
# of Days on Hand - Average Month Inventory $ vs Average Daily Sales/Month
Storage Utilization % - Average Occupied Sq. Ft. vs Total Storage Capacity
Dock to Stock Time in Hours - Total Dock to Stock Hours vs Total Receipts
Inventory Visibility Hours - Receipt Entry Time vs Physical Receipt Time
WIP Inventory/Turns – A commonly used ratio calculation to measure the efficient use of inventory materials. It is calculated by dividing the cost of goods sold by the average inventory used to produce those goods.
Warehouse Performance Metrics
Orders per Hour - Orders Picked/Packed vs Total Warehouse Labor Hours
Lines per hour - Lines Picked/Packed vs Total Warehouse Labor Hours
Items per hour - Items Picked/Packed vs Total Warehouse Labor Hours
Cost per order - Total Warehouse Cost vs Total Orders Shipped
Cost as % of sales - Total Warehouse Cost vs Total Orders Shipped
Downtime in Proportion to Operating Time – This ratio of downtime to operating time is a direct indicator of asset availability for production.
As warehouse managers expand on the list of metrics to meet more specific needs in their operations. Additional metrics warehouse managers use are shown below:
Productivity measure of direct labor cost vs handling revenue
Adjustments to cycle counts. Watch to understand if cycle counting employees are actually completing counts or doing them from a desk. (This only applies if you have a WMS.)
The ratio between support workers, clerks, supervisors, managers and floor workers. As a general rule, keep the ratio of support workers below 20% to 25%.
Overtime hours per person
Cube through put per man hour
Inventory adjustments vs. credit memos from customers
POI - Perfect Order Index
CPU - Cost Per Unit
UPH - Units Per Hour
Revenue per sq. ft.
Space usage
Labor utilization
Employee turn-over
Reportable Health and Safety Incidents – A measure of the number of health and safety incidents that were either actual incidents or near misses that were recorded as occurring over a period of time.
We have reviewed many of the measurement/metrics used in a warehouse operation above and below you will find resources for benchmarking.
Resources for benchmarking:
The Aberdeen Group - www.aberdeen.com - "The Extended Warehouse Benchmark Report"
APQC - www.apqc.org/OSBCdatabase - "Process Classification Framework & Open Standards Benchmarketing Collaborative"
CSCMP - www.cscmp.org - "Multiple Process Standards & Metrics Reports, Annual State of Logistics Report"
Establish United Logistics Group - www.establishinc.com - "Cost, Service, Transportation Rate & 3PL Benchmarks"
Georgia Tech - www2.isye.gatech.edu/ideas/ - "System-Based Self-Assessment of Warehouse Operations"
Supply Chain Execution Systems & Technologies Group - www.mhia.org - Using Technologies to Increase Perfect Order Metrics
Supply Chain Metric - www.supplychainmetric.com - A Comprehensive Look at Performance Metrics, Definitions & Calculations
Supply Chain Consortium - www.supplychainconsortium.com - Benchmarking Services for Manufacturers, Distributors & Retailers
Supply Chain Council - www.supply-chain.org - Supply-Chain Benchmarking with SCOR and SCORmark
Warehousing Education and Research Council - www.werc.org - Multiple Reports, Publications & Tools including Warehouse Manager’s Guide to Benchmarking
Measure progress against the warehouse's own targets vs against other operations because performance depends on a variety of unique factors such as processes, specific customer expectations, and automated materials handling infrastructure.
At the top of priority list for many is Productivity in Revenue per Employee. This is a measure of how much revenue is generated by a plant, business unit or company, divided by the number of employees.
This is where Newcastle Systems is focused. Productivity, profit, safety and employee morale are all the result of changing from a stand up workstation to a mobile computer/printer workstation with power. By integrating a rolling cart with power, the employees no longer waste steps walking back and forth.
We would be happy to provide you our newly updated Portable Power Systems Product Overview.

“Continuous improvement is better than delayed perfection.” Mark Twain
