Your warehouse KPIs determine how efficiently you turn a profit. If you’re running your warehouse fast and loose, how do you know what is there, what’s coming in, or what’s heading out the door?
You probably already have a software package that compiles data and analyzes information. What you do with that information may determine the success or failure of your logistics business. Specifically, you need to determine the metrics that matter when measuring warehouse performance.
What Are Warehouse Metrics?
 Warehouse metrics are specific key performance indicators (KPIs) used to identify performance over a specified period. They are quantifiable measurements that a warehouse can use to gauge progress and help the operation make better business decisions.
Similar to conducting performance reviews or evaluating your business’s financial statement, measuring warehouse performance gives you insight into how effectively your processes are working compared to benchmarks or past performance.
So, how do you measure warehouse efficiency to improve results? Here are some commonly used warehouse KPIs broken down by function:
General Warehouse Management KPIs
Some general warehouse metrics you should track arent’ tied to a specific area of your operations. But they will tell you something vital about how your warehouse is running and if there is something you may wish to address.
1. Backorder Rate
Backorder rate shows how hard it is for you to fill orders. When demand spikes, you may see temporary backorders. If backorders become a long-term problem, you have to figure out why before you have unsatisfied customers.
2. Perfect Order Management
Perfect order management indicates which links in the chain are broken, whether it’s procurement, production, transportation, labor, or any stage of the warehouse process.
3. Supply Chain Cycle Time
This metric measures what would possibly happen if you had no inventory on hand whatsoever. Then you determine how long it takes you to fill an order. When this time is shorter, you have better supply chain management.
4. Customer Order Cycle Time
 Your customer order cycle time examines how quickly a customer gets an order. The faster, the better, in this instance. If this changes, figure it out quickly.
5. Demand Forecast
The demand forecast is hard to predict, but analytics software helps. When you have accurate demand forecasts, you prevent bumps in the road with regards to pricing, capacity, and whether to expand your operations.
6. Rate of Return
The rate of return gives you a chance to determine why customers return things. Knowing why lets you solve the problem of too many returns quickly.
7. Days Sales Outstanding
How quickly do you receive payments from customers? Fewer days outstanding means your accounts receivable department is efficient and collects money quickly.
8. Cash to Cash Cycle Time
The cash to cash cycle time measures days between paying for something coming into your warehouse before it gets shipped out. When this time is lower, your materials spend less time in the warehouse.
Inventory KPIs
Any business that keeps inventory knows that this is far from a passive activity. Even though goods are sitting on your shelves, how accurate your records are and how quickly that inventory turns over can impact your bottom-line results.
9. Inventory Turnover
Your inventory turnover measures how many times per year your warehouse goes through its entire stock. A high turnover rate means you’re doing something great. Products flow in and out readily and without any hitches. A warehouse management system lets you figure out weak points in your inventory before things start to sit there for a long time.
10. Days on Hand
Days on hand is part of inventory turnover because it measures how much your storage costs build up over time. When products sit there for several days, it costs you money.
11. Inventory Accuracy
Inventory accuracy is extremely important if you want to fill orders properly. If your accuracy isn’t high, you might lose a lot of customers because you don’t have anything in stock when your computer says you do have something there. Items connected wirelessly update your computers instantly to keep your inventory accurate. Large operations need technology to produce accurate numbers.
12. Inventory to Sales Ratio
Your inventory to sales ratio changes depending on the economy and how your company gets through disruptions. Predictive analytics software lets your managers figure out a way to get through cash flow problems in the future. An inventory to sales ratio can prevent backorders as well.
13. Carrying Cost of Inventory
In the big picture, your entire warehouse makes money based on this KPI. The carrying cost of inventory measures how much it costs to store inventory over a period of time. These factors in energy costs, labor, downtime, shipping, freight, and insurance.
Receiving and Putaway KPIs
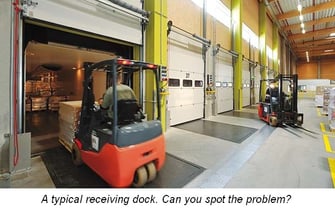
Receiving occurs when the warehouse accepts delivery of goods that requires processing and sorting. Putaway is the process of placing those items where they belong in the warehouse so they can be accessed by pickers for order fulfillment.
14. Time to Receiving and Pick Location
How long do you need to intake inventory? This metric measures the speed and efficiency with which your staff unloads something and gets a product to its place in the warehouse. This ties into your truck time in the dock and days on hand.
15. Receiving Cycle Time
This metric reveals the average time it takes for your warehouse’s received stock to be counted, recorded, and prepared for storage. If the figure is too high, it will impact your other metrics.
16. Putaway Accuracy Rate
How accurate is the process for putting items coming into your warehouse? If items aren’t put away correctly the first time, this leads to inefficiencies, lost business, and lower customer satisfaction.
Picking KPIs
Warehouse managers understand that order picking can be one of the more complex activities that take place in the operation. How fast your orders get shipped and customers get items can depend on picking accuracy and efficiency, meaning you should track several picking KPIs.
17. Orders Picked Per Hour
Tracking your picking productivity can give you a rough idea of the efficiency of your operations. For example, if there are changes from shift to shift, you may need to make adjustments in the makeup of your team. Otherwise, the technology you are using could require an upgrade.
18. Order Picking Accuracy
Inaccurate orders lead to more returns, dissatisfied customers, and fewer sales because clients go elsewhere. In today’s high-tech world of online ordering, a world-class accuracy order rate is 99.9 percent. Can you handle that?
Packing and Shipping KPIs
Getting products ready to ship and out the door can be a complex process in a busy warehouse. Every operation is different, but you can use these KPIs to measure what is working and what isn’t.
19. Truck Time at the Dock
Everything within your warehouse needs to leave your unit to be profitable. If a truck spends too much time at the, dock it identifies possible staffing problems, low inventories, infrastructure, or some kind of handling difficulty. Trucks should spend the least amount of time at the dock as possible so another truck can come in and load or unload.
20. Cost Per Line Item Shipped
The cost per line item shipped examines the microeconomics of your logistics operation. This metric measures how much it costs to handle and ship one item out of your warehouse. It’s a good bit of data to have on hand because shipping one item melds people, computer systems, and how your warehouse moves products. Any increases in metrics need a closer look so you can keep costs and prices down.
21. Fill Rate
The fill rate shows what percentage of orders you fill on the first shipment. This metric combines customer satisfaction and transportation efficiency.
22. Freight Cost Per Unit
The freight cost per unit talks about transportation costs. Try bundling orders together to lower your shipping costs.
23. On-Time Shipping Rate
Your on-time shipping rate leads to happy customers who are more likely to order more items from you in the future. When this number is high, you have a great relationship with a transportation firm.
Warehouse Safety KPIs
Warehouses can be hazardous environments, with a lot of moving equipment and workers asked to perform repetitive tasks or even dangerous ones. These warehouse safety KPIs are essential to maintain a safe working environment and control costs.

24. Warehouse Accident Rate
This KPI tracks the rate of accidents in a month, quarter, or year in your warehouse. Ideally, the figure will be zero, but you can track it over time with certain goals in mind.
25. Time Since Last Accident
This metric indicates how long it’s been since the last workplace accident. The higher the number, the better.
Using warehouse metrics can give you insight into how your operations are performing over a certain period. So they are particularly useful when you are looking to improve in certain areas or have specific goals. Learning the purposes of each type of warehouse KPI can help you choose the right indicators that line up with the functions you have in your warehouse or distribution center.
One way we can help manage these KPIs is through mobile workstations. Contact us today to improve your warehouse metrics with an on-the-go solution from Newcastle Systems.


